The 🔵Optimist: (L)Earn with Defi #32
Tips, Tools & Strategies for your personal journey in DEFI on the Superchain
Welcome in Part 2 of this newsletter providing tools & tips to ease your journey in personal finance management in Web 3.
If you missed our previous Superchain News, don’t worry, just click HERE.
Click on your preferred language to access the translated version:
Chinese - French - Japanese - Persian - Spanish - Thai - Vietnamese
————————————— KEY TAKEAWAYS ——————————
🔵Base Vs Solana- Battle of the Titans or David and Goliath ?
Opportunities lie where money is. We have followed the money, and we know where it landed!
🟢Crypto market review
Bi-weekly update on the Crypto Market.
➡➡➡🤯Quote of the week
🟢My Trading Routine
Axel is trading since 2017, learned a lot from the 2 past cycles, have scooped the bottom in 2023 on lots of alts. What he is doing you’re not ? He will reveal everything here.
🟤Unlocking the Secret: Mastering the Art of Estimating YT_token Airdrop
Pendle has been the one shop place to farm Projects airdrop. People got 800% ROI (return on investment) on $ENA, and estimation on Eigen Layer & LRT protocols are close to 3 digits ROI too. We will give you all you need to know to estimate your earnings.
Spotlight project: Stake Together
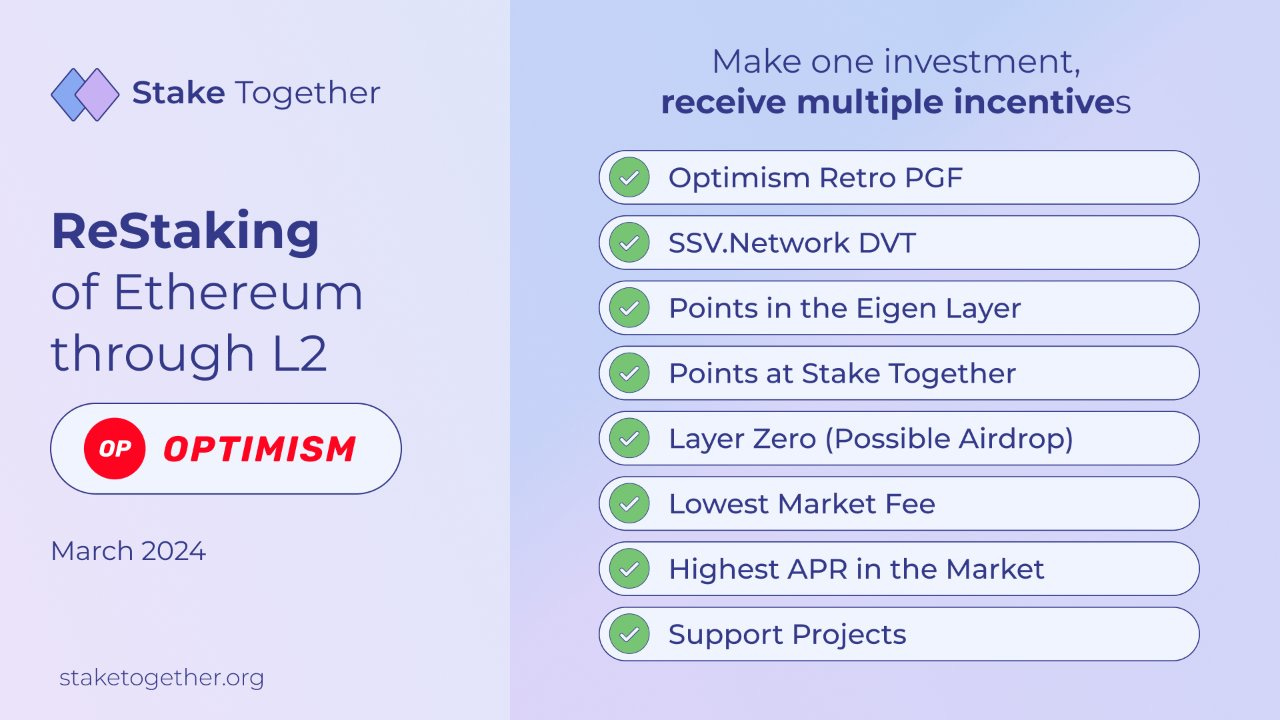
Stake Together is a Liquid (Re)Staking Protocol on Optimism that offers the highest yield on the market, and can also fund public good projects by directing a share of the protocol fees to fund whitelisted projects.
Soon, their ReStaking solution will launch on OP Mainnet and will grant ETH stakers cheap fees to restake on EigenLayer as well as all the following rewards.
Ready to 🥩? Visit StakeTogether now.
🔵Base Vs Solana- Battle of the Titans or David and Goliath ?
by Subli
Following narrative is necessary to not become an Exit Liquidity. More than ever, if you follow this move on X, as a Crypto Twitter (CT) addict like I’m, this just means you’re miles behind everyone else.
People are comparing SOLANA to ETHEREUM, but while SOLANA tech is improving, ETHEREUM is now focusing on scaling the chain through L2sssss. So the best would be to compare it to BASE.
Facts are worth thousands words, so in this article we will explore what is the most active ecosystem, and where more specifically. My research routine is to focus one ecosystem i believe will pop up, study metrics, and invest in the primary ecosystem such as DEX.
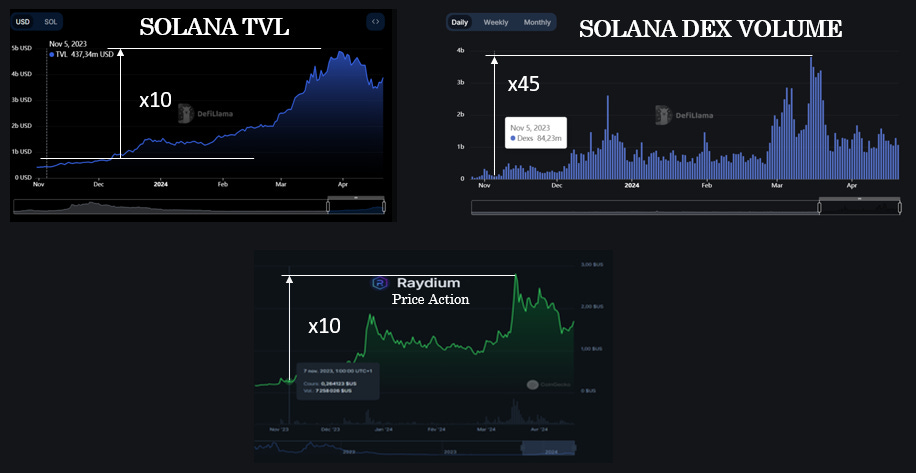
Take SOLANA for example, the metrics would have told you everything if you focused on it before the crowd comes in, and being an early investor in the 2nd DEX of the chain RAYDIUM.
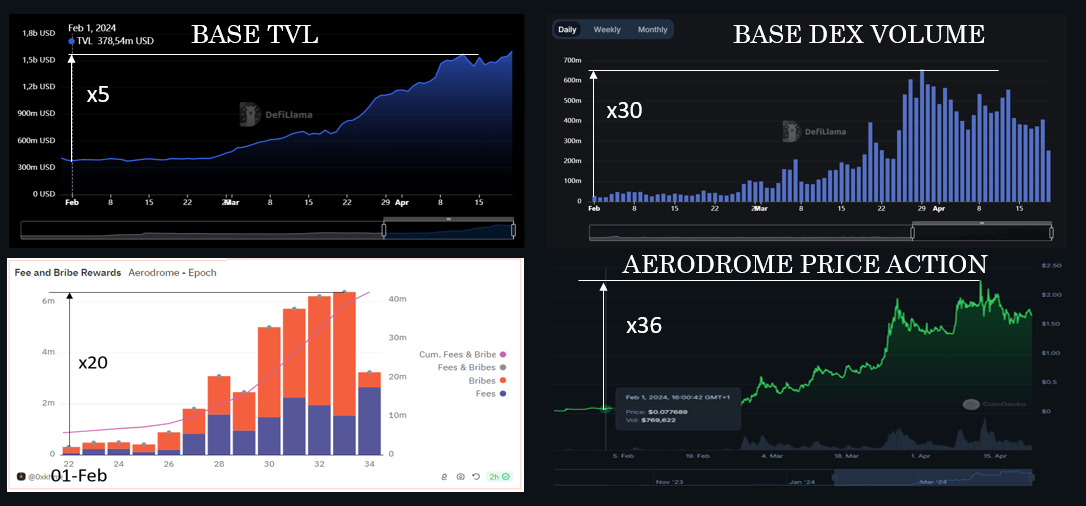
Now, let’s look at some metrics about BASE with the 1st DEX of the chain AERODROME that we, at The Optimist, follow since inception:
Base launched in Aug-2023
Base is the onchain version of Coinbase
Base is Based
The real thing started kicking off up in March 2024:
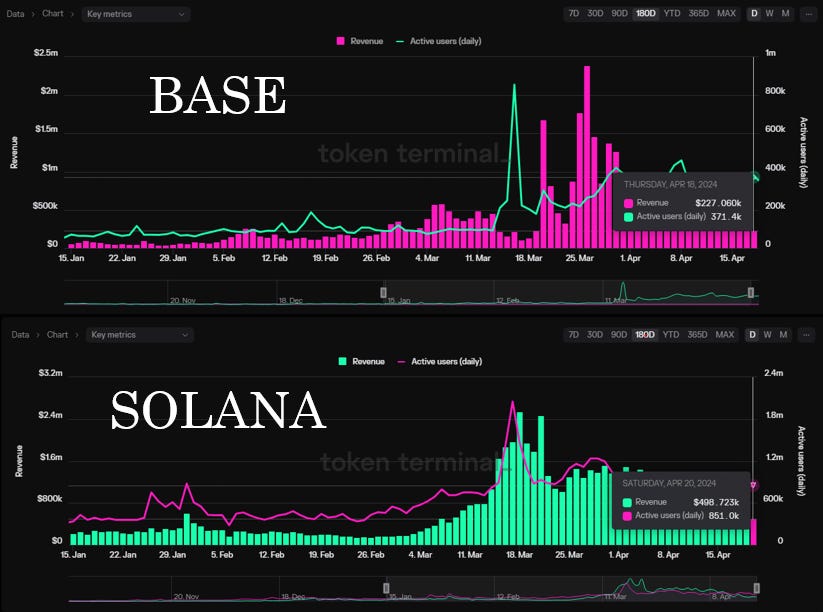
Thanks to Tokenterminal, I could access some interesting data:
SOLANA has 2.2x more TVL than Base (exlcuding $SOL), 2,3x more Daily Active Users, and generates 2,2x more revenue => Pretty linear metrics, very interesting to see. The more TVL will accrue to Base, likely the more Revenue & Users it will bring.
So BASE is only HALF of SOLANA, but:
BASE has no governance token
BASE TVL is still increasing as we are very early in the growth phase
BASE has COINBASE to push on the marketing
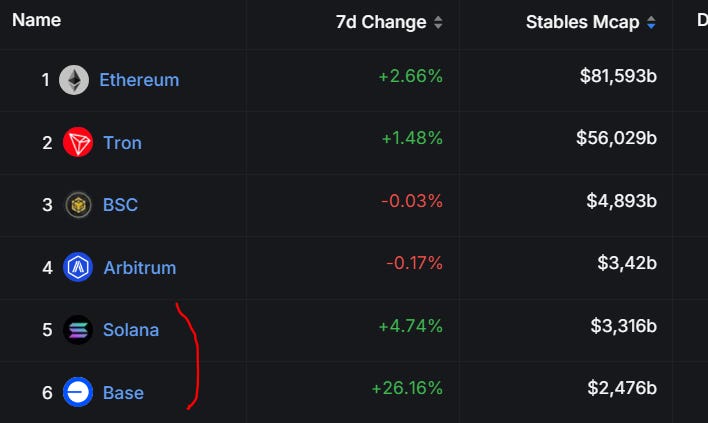
And finally, one important health factor is STABLECOINS market cap on the chain. The more stables, the more likely people have powder to deploy capital on the chain:
The inflow rate into BASE is incredible, and again WITHOUT a governance token. SOLANA has only 1.34x more Stables on the chan than BASE.
In terms of chain efficiency, even though SOLANA reached 3k TPS (transactions per second) whereas BASE peaked at 400 TPS
Both chains experienced outage (Base in Sep-23 and Solana in Feb-24 but not its 1st time though).
Ecosystem comparison SOLANA / BASE:
As said, when betting on a chain, check the top tiers native projects of the eosystem.
Top DEX: ORCA & RAYDIUM / AERODROME
Memecoin: WIF / TYBG & TOSHI
Unicorn projects: PYTH / FRIENDTECH (V2 planned for 29.04.24)
Narratives: DEPIN (HELIUM & RENDER) / my best guess for Base is RWA: BLACKROCK has set up its 1st digital fund '“BUILD” + Centrifuge, Florence, Angle, … → Expect an article on BASE-RWA projects very soon from our side
The initial ecosystem participants in BUIDL include @Anchorage, @BitGo,
@coinbase , and @FireblocksHQ, among other market participants and infrastructure providers in the crypto industry.
Conclusion:
My first take is that comparing BASE to SOLANA and seeing metrics being so close (only x2) between a L1 and a L2 is just already ONE fucking achieved milestone for Jesse Pollack & his Base(d) team.
And when you realize that we are just at the beginning of BASE growth, the future looks very…very bright.
BASE airdrop or not, BASE is making the job to:
Attract the best worldwide builders (hackaton, grants, Coinbase Ventures)
Set the foundations for institutions to come onchain (Securitize, Definitive)
Attract retails to get used to onchain actions (coinbase smartwallet)
Work on scalability at BASE level (L3, increased TPS)
Work on Decentralization (fault proof deployed on testnet)
Well, i may be biased, but facts don’t lie.
Now are you able to perform a similar research on Mode? 🟡😏
🟢Crypto market review
by Axel
Bitcoin
Happy Halving to all! With the mining difficulty doubling, miners now receive half the amount of Bitcoin they did before the halving. Presently, the cost of mining one bitcoin is around $75,000.
Market sentiment is low, and altcoins have experienced significant corrections. What should one do in such times? We'll share our market insights here. In the second part, we'll offer a trading routine to help navigate these uncertain moments.
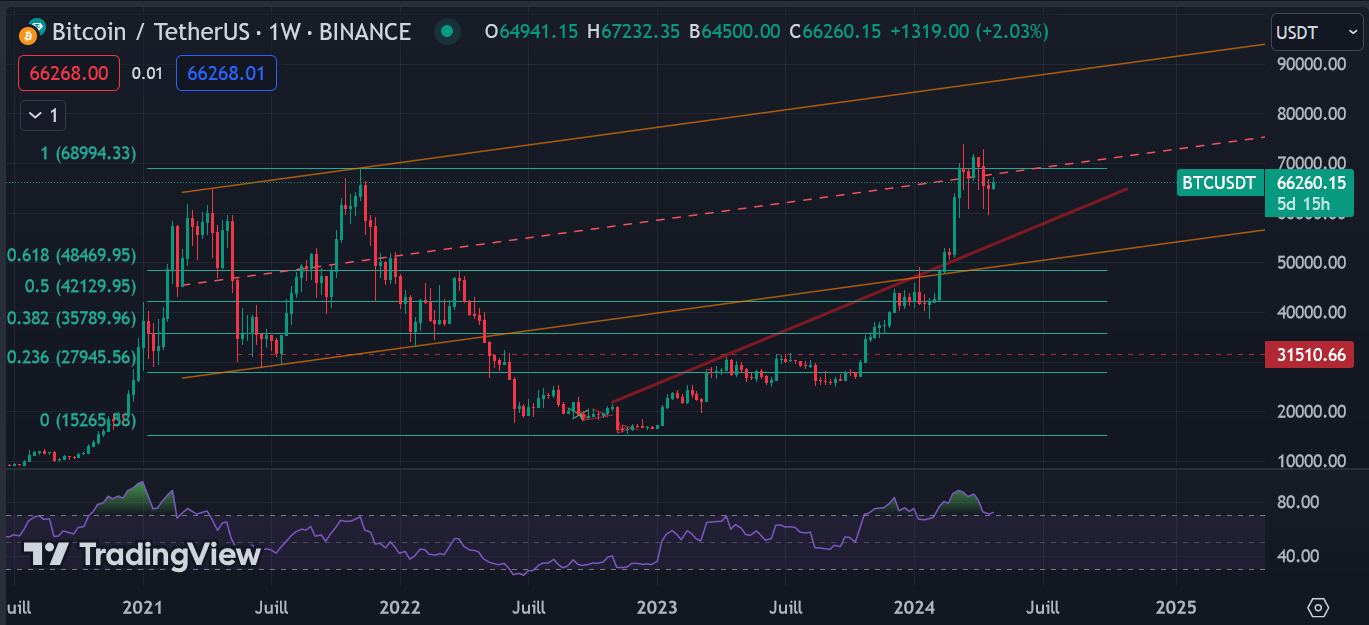
Bitcoin continues its consolidation. The midpoint of the range has been broken to the downside. We will take a closer look at this movement on the daily timeframe.
Bullish signs: Bitcoin is still trading within its bullish channel. Bitcoin has already corrected by 20%.
Bearish signs: The weekly RSI is high but without divergence. The price is trading below the middle of the range.
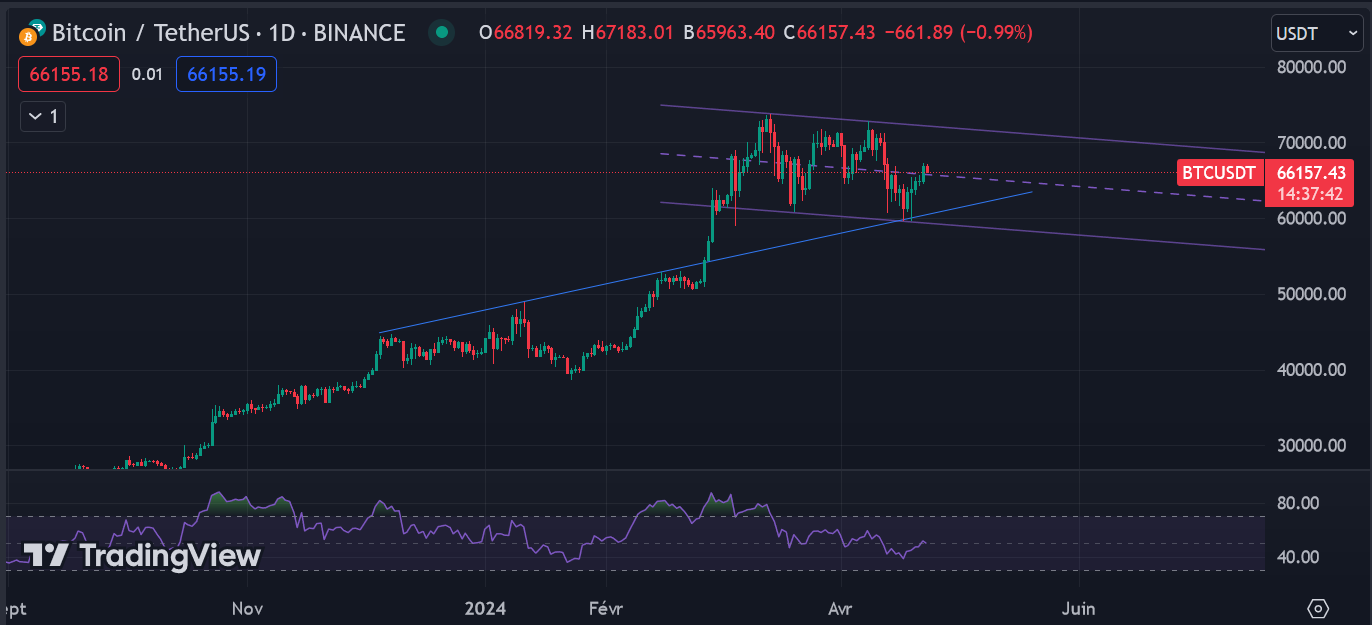
In the daily timeframe, Bitcoin is moving within a descending channel. The RSI has reset. The consolidation triangle mentioned in the previous newsletter did not materialize.
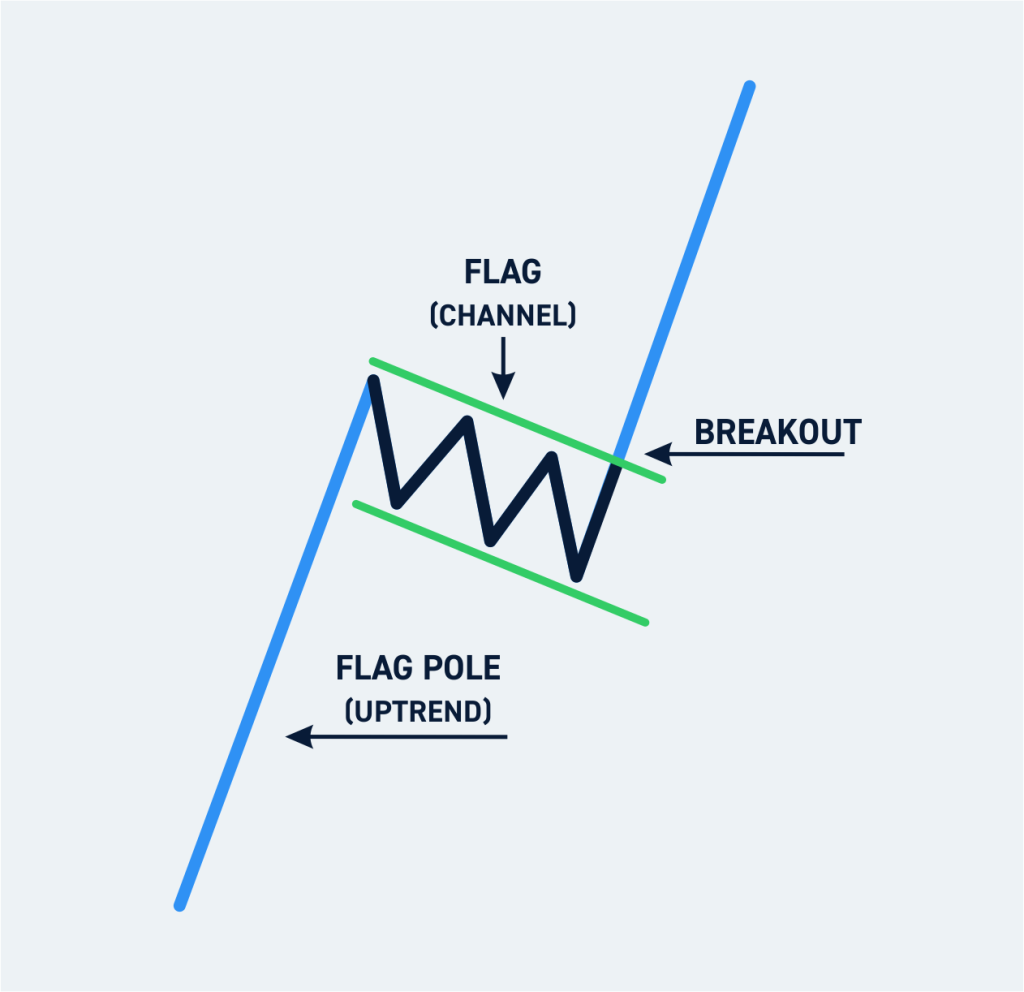
This is very bullish, and forming a well known pattern: 🐮 Bull flag
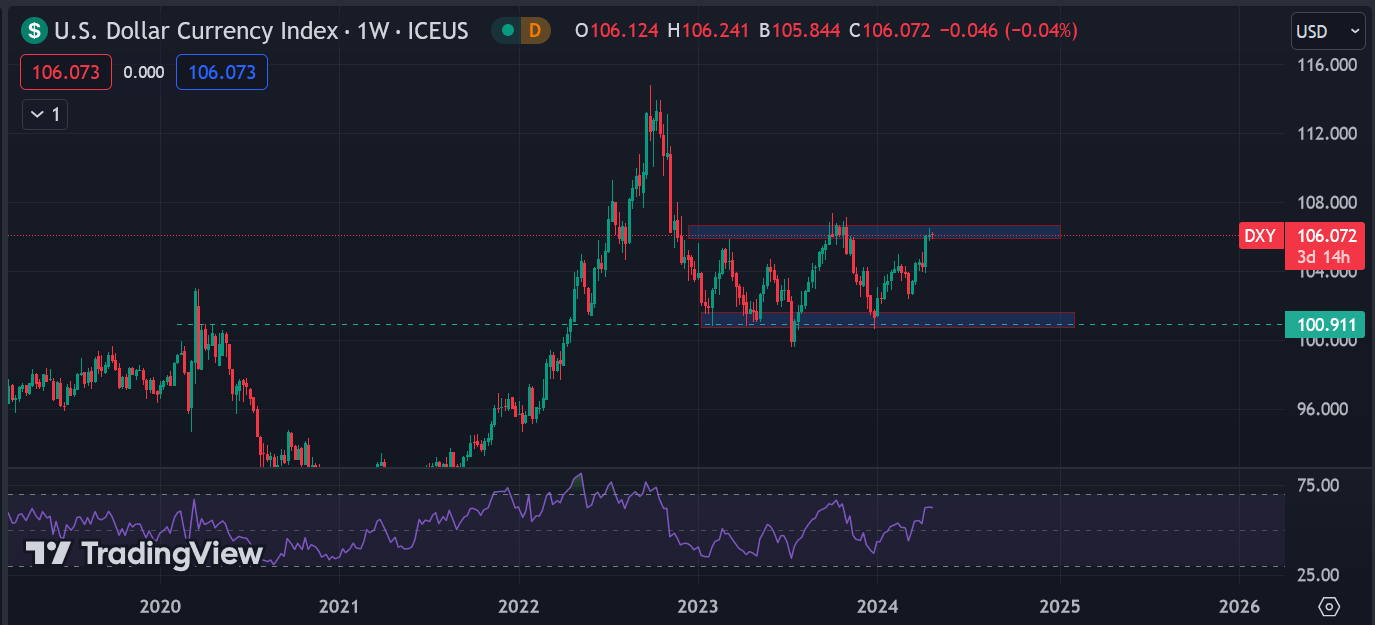
DXY
The DXY index is moving within a range until proven otherwise. A decline in this index would be a positive sign for the cryptocurrency market.
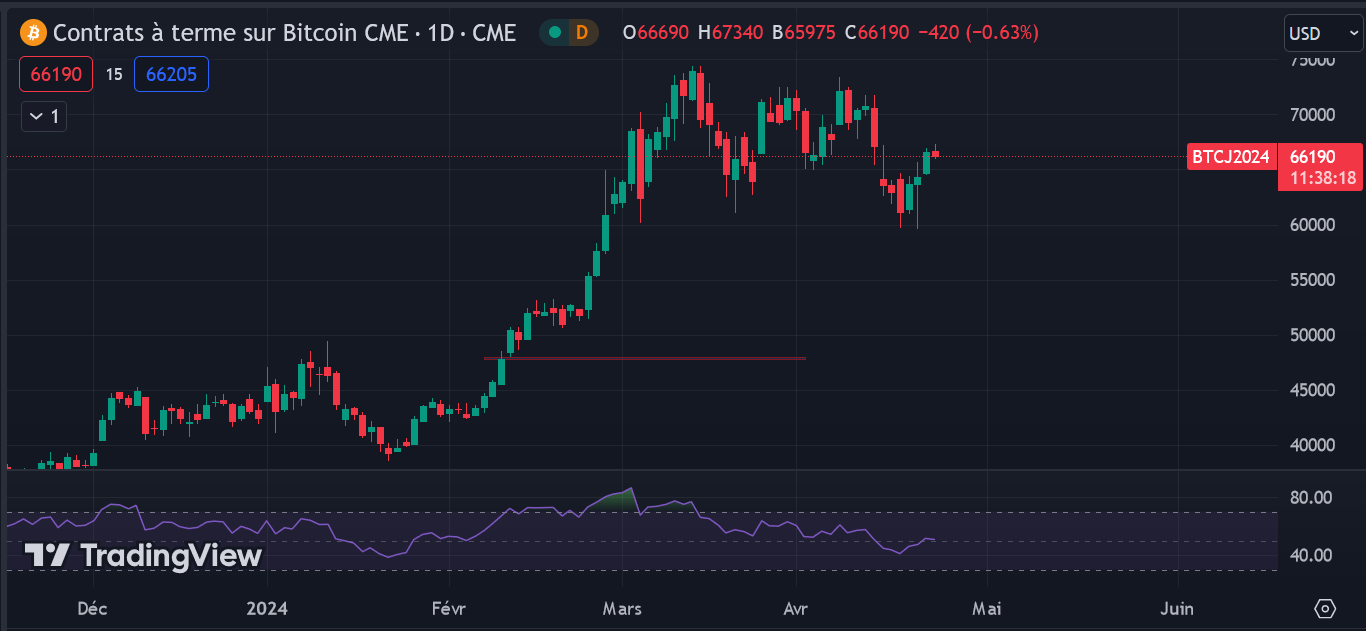
CME gap
New CME gaps have opened since the previous newsletter, but have since been closed.
However, we still have an open CME gap at $48,000.
Feel free to refer to NL #5 to understand how to interpret the CME gaps.
Altcoin
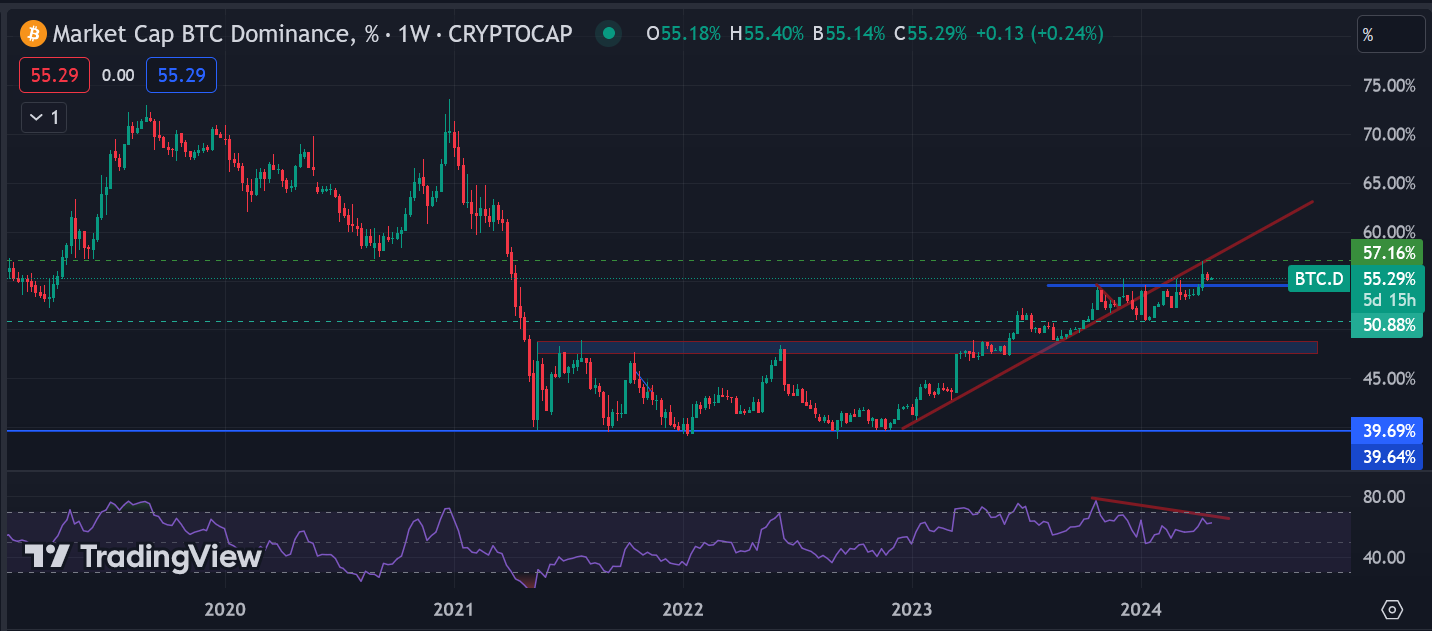
Bitcoin Dominance: The resistance has been broken to the upside. Altcoins have corrected significantly compared to Bitcoin. However, we are now observing a weekly divergence.
ETHBTC: The pair continues to consolidate and diverge on the weekly chart. The price action is disappointing on this pair. However, we maintain our convictions and see it more as a capitulation, similar to what happened in December 2020, highlighted here in orange.
Conclusion
In the daily timeframe, Bitcoin is forming a bull flag. We believe that this bullish channel will break to the upside because the trend is upward. Altcoins have corrected significantly, some by more than 50% and some of them are currently consolidating. Some of you may prefer to deploy capital during a consolidation phase, while others may prefer to wait for a breakout. In any case, it is on this type of price action that WE take our positions.
On one hand, the market could quickly rebound. Indeed, the DXY appears to be at the top of its range, which would put the crypto market in the spotlight. Furthermore, market sentiment is low if you follow Crypto Twitter. It's important to exhaust the sellers so they can buy higher and provide momentum for the new bullish movement.
However, we are also entering a period known as summer trading. The months of May, June, and July are rarely conducive to financial markets.
We must remain patient. Markets are designed to transfer wealth from the impatient to the patient. It's important to keep the big picture in mind, which is what we offer here every two weeks. Additionally, we have presented the TOP signals that will prompt us to exit the market (NL #30-2), and these have not yet flashed. It's not time to panic (yet).
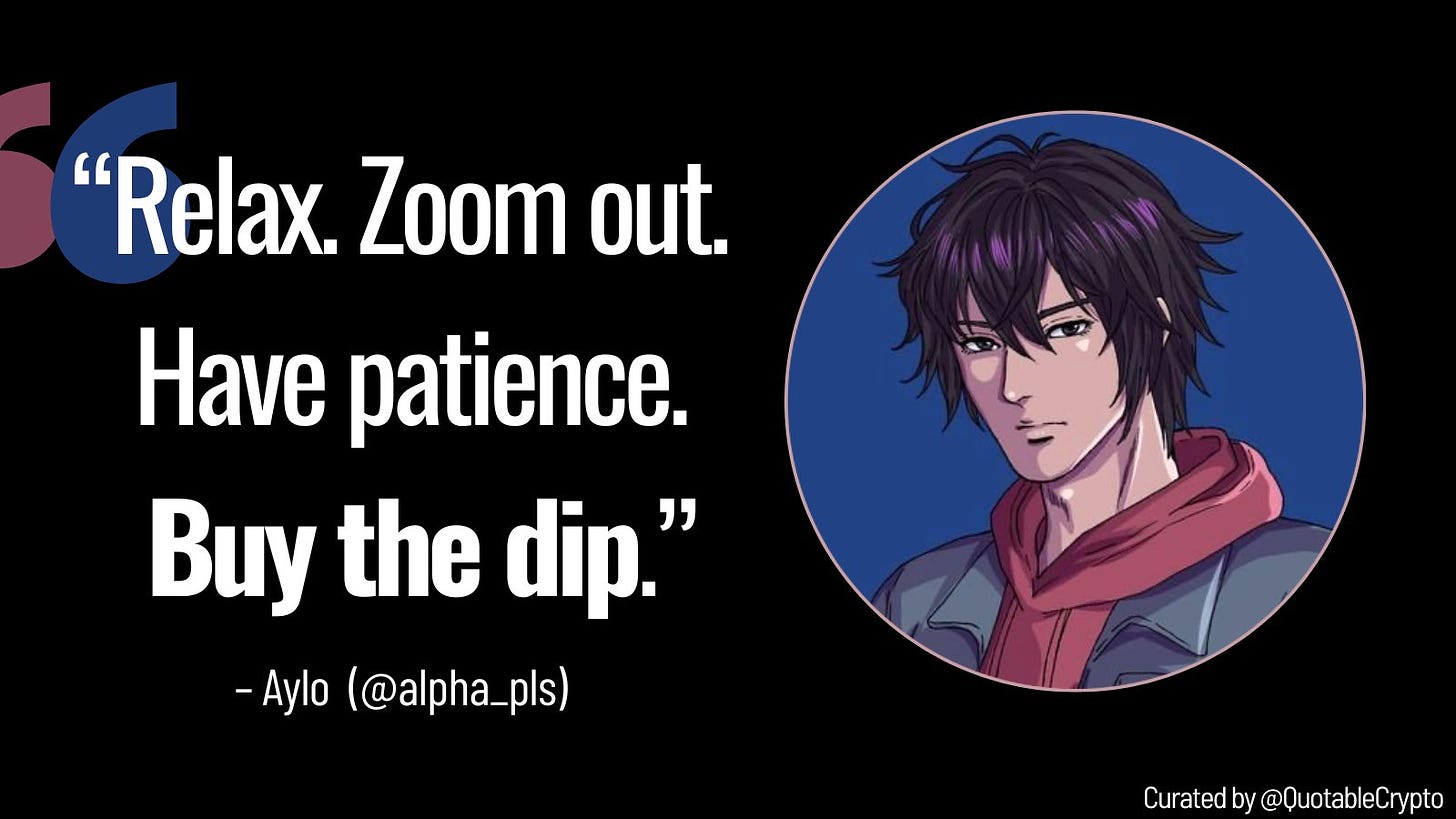
🤯Quote of the week
By courtesy of QuotableCrypto
🍀My Trading Routine
By Axel
The goal of this routine is to identify the 🔴red flags shown by the market and to react before the dump, allowing us to protect our capital. Today, we'll look at the signals to watch for to seize opportunities during these downward movements.
First and foremost, you need to understand that we're playing on long-term positions here. While our above analyses are on a weekly timeframe, red flags presented here are to be monitored on the Daily timeframe.
This type of dump is not a market top signal; on the contrary, it allows us to take a breath before a new bullish momentum.
It's important to understand that at each 🔴red flag, we de-risk our positions. This means that we'll withdraw 10 to 20% from our medium-term positions to de-risk our positions:
If the market pumps, we're still heavily invested, profiting from the market's rise. Se buy higher, and will sell a lot of higher.
If the market dumps, we have powder to buy the dips
In any case, we win.
Bitcoin
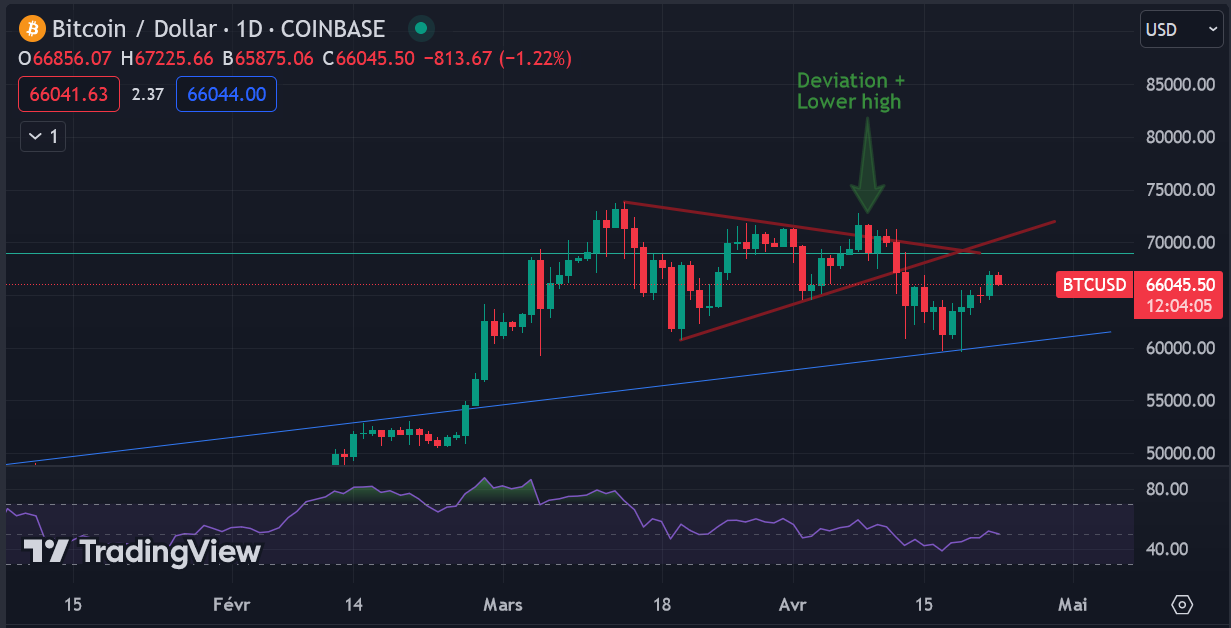
Initially, we were playing a compression triangle:
However, after a fake out, the price re-entered the triangle. Higher low + RSI divergence (NL# 26-2) = 🔴🔴Double red flag.
Altcoins leaders
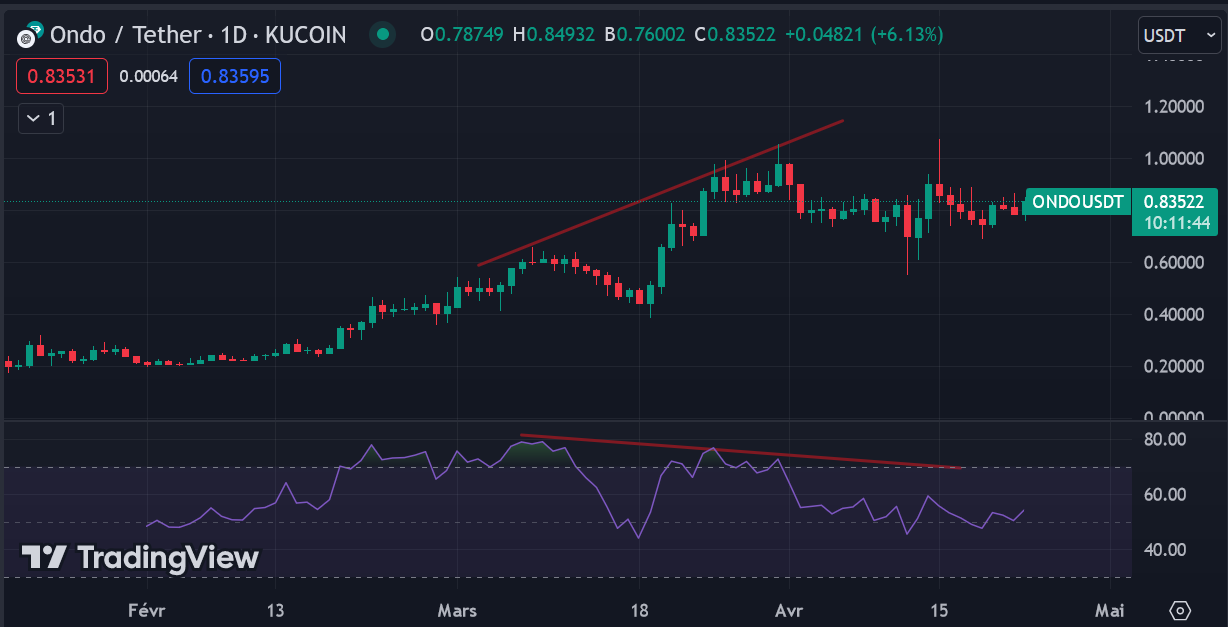
$ONDO [RWA]
$FET, [AI]
Leading Altcoins of the most hyped narratives have the same price action: Higher High + RSI divergence = 🔴Red flag.
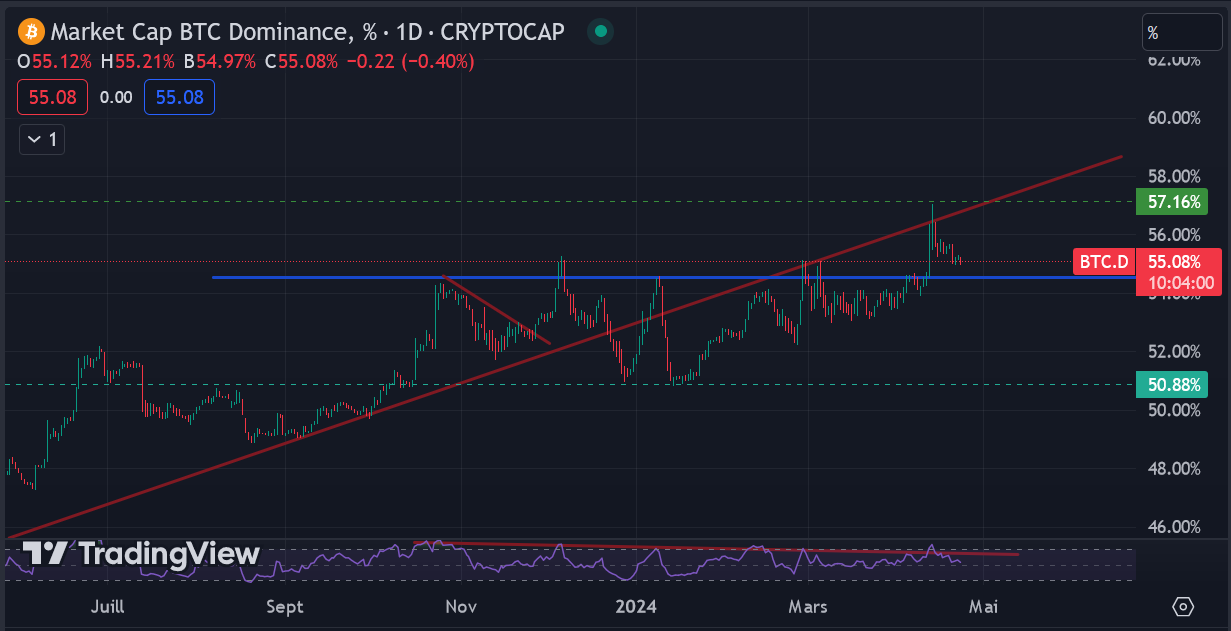
Ticker BTC.D
The price has broken above the blue resistance that we have been monitoring for the past few months = 🔴Red flag.
Let's recap:
Bitcoin has formed a higher low on the daily chart with a deviation and a bearish divergence. Major altcoins are showing daily divergences as well. Bitcoin dominance has broken its resistance.
Each time, we have taken profits on our oldest positions, after being in profits at around X10-X50. For the most recent positions, we prefer to cut them for now until the market stabilizes. At worst, we would have bought back at a higher price to sell even higher.
We didn't exit at the top of the market, but it allowed us to repurchase our bags at a discount of 20 to 40%.
Conclusion:
Following the key indicators on a weekly basis allows you to manage your long term investment. Doing this Daily allows you to maximize your investment strategy. This routine could have helped you avoid significant losses in your portfolio and to lower your buying levels.
Here is my strategy!
It's not necessary to master complex tools, as you can see from our analyses presented every two weeks. However, knowledge is power, and it's important to educate yourself on these subjects. Practice and experience will make you profitable.
🟤Unlocking the Secret: Mastering the Art of Estimating YT_token Airdrop
By Thomas
Dear readers,
As of today, most projects are launching points campaigns.
Although these methods are not always appreciated by the community, these systems have the advantage of being more easily farmable.
Discover how to use Pendle's YT product to maximize your points farming strategies.
What is Pendle ?
Pendle is truly THE protocol used by farmers.
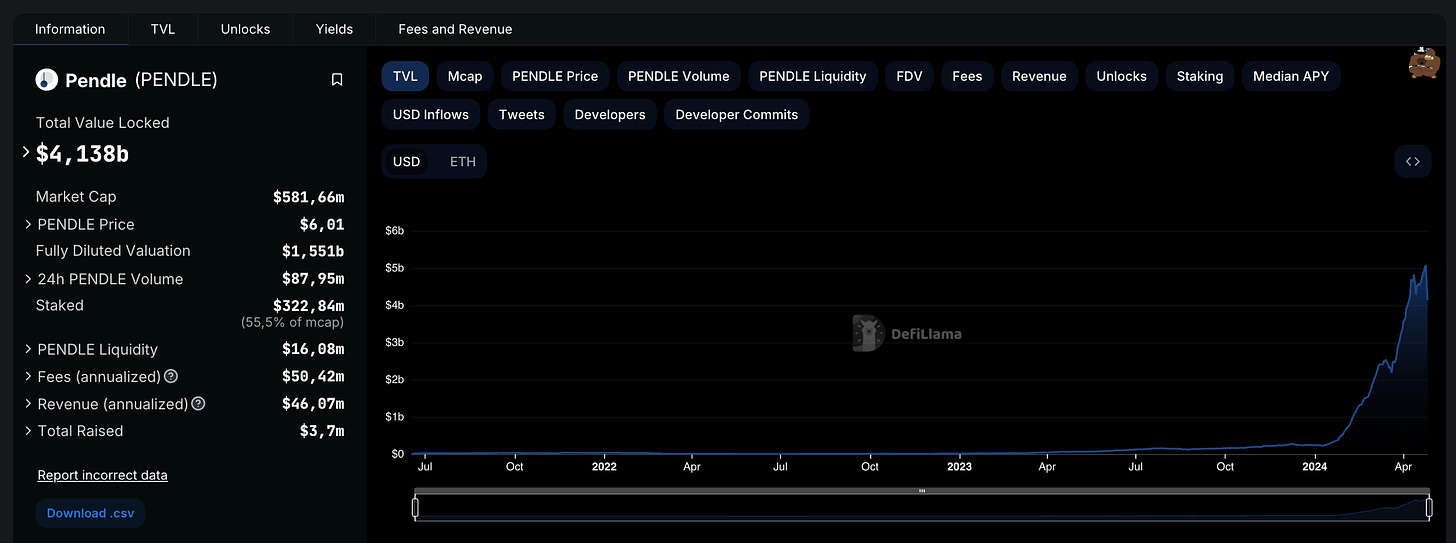
Since the introduction of LRTs earlier this year, the platform has seen its TVL skyrocketing: it now boasts approximately $4.15 billion in deposited value.
We've already introduced Pendle several times in editions 17 & 26-2 of our newsletter, but if you're still unsure what it is, here's a TLDR:
Pendle is a protocol that allows you to split a yield-bearing asset (such as $wstETH) into two tradable assets:
The Principal Token (PT), which is intended for farmers seeking a fixed yield.
This token has a maturity date. At the end of this date, PT holders receive the underlying asset.The Yield Token (YT) is adopted by farmers wishing to speculate on the yield associated with the underlying asset.
At the end of the YT's maturity, the token is worth 0. Only the yield associated with the YT is retained.
The most important thing to understand is this: Underlying Asset = PT + YT.
Why is the YT so popular?
The democratization of the YT product has been caused by the arrival of LRTs and their points systems.
Why? Because by buying YT tokens, you're not only amplifying the yield of the underlying asset but also its points generation!
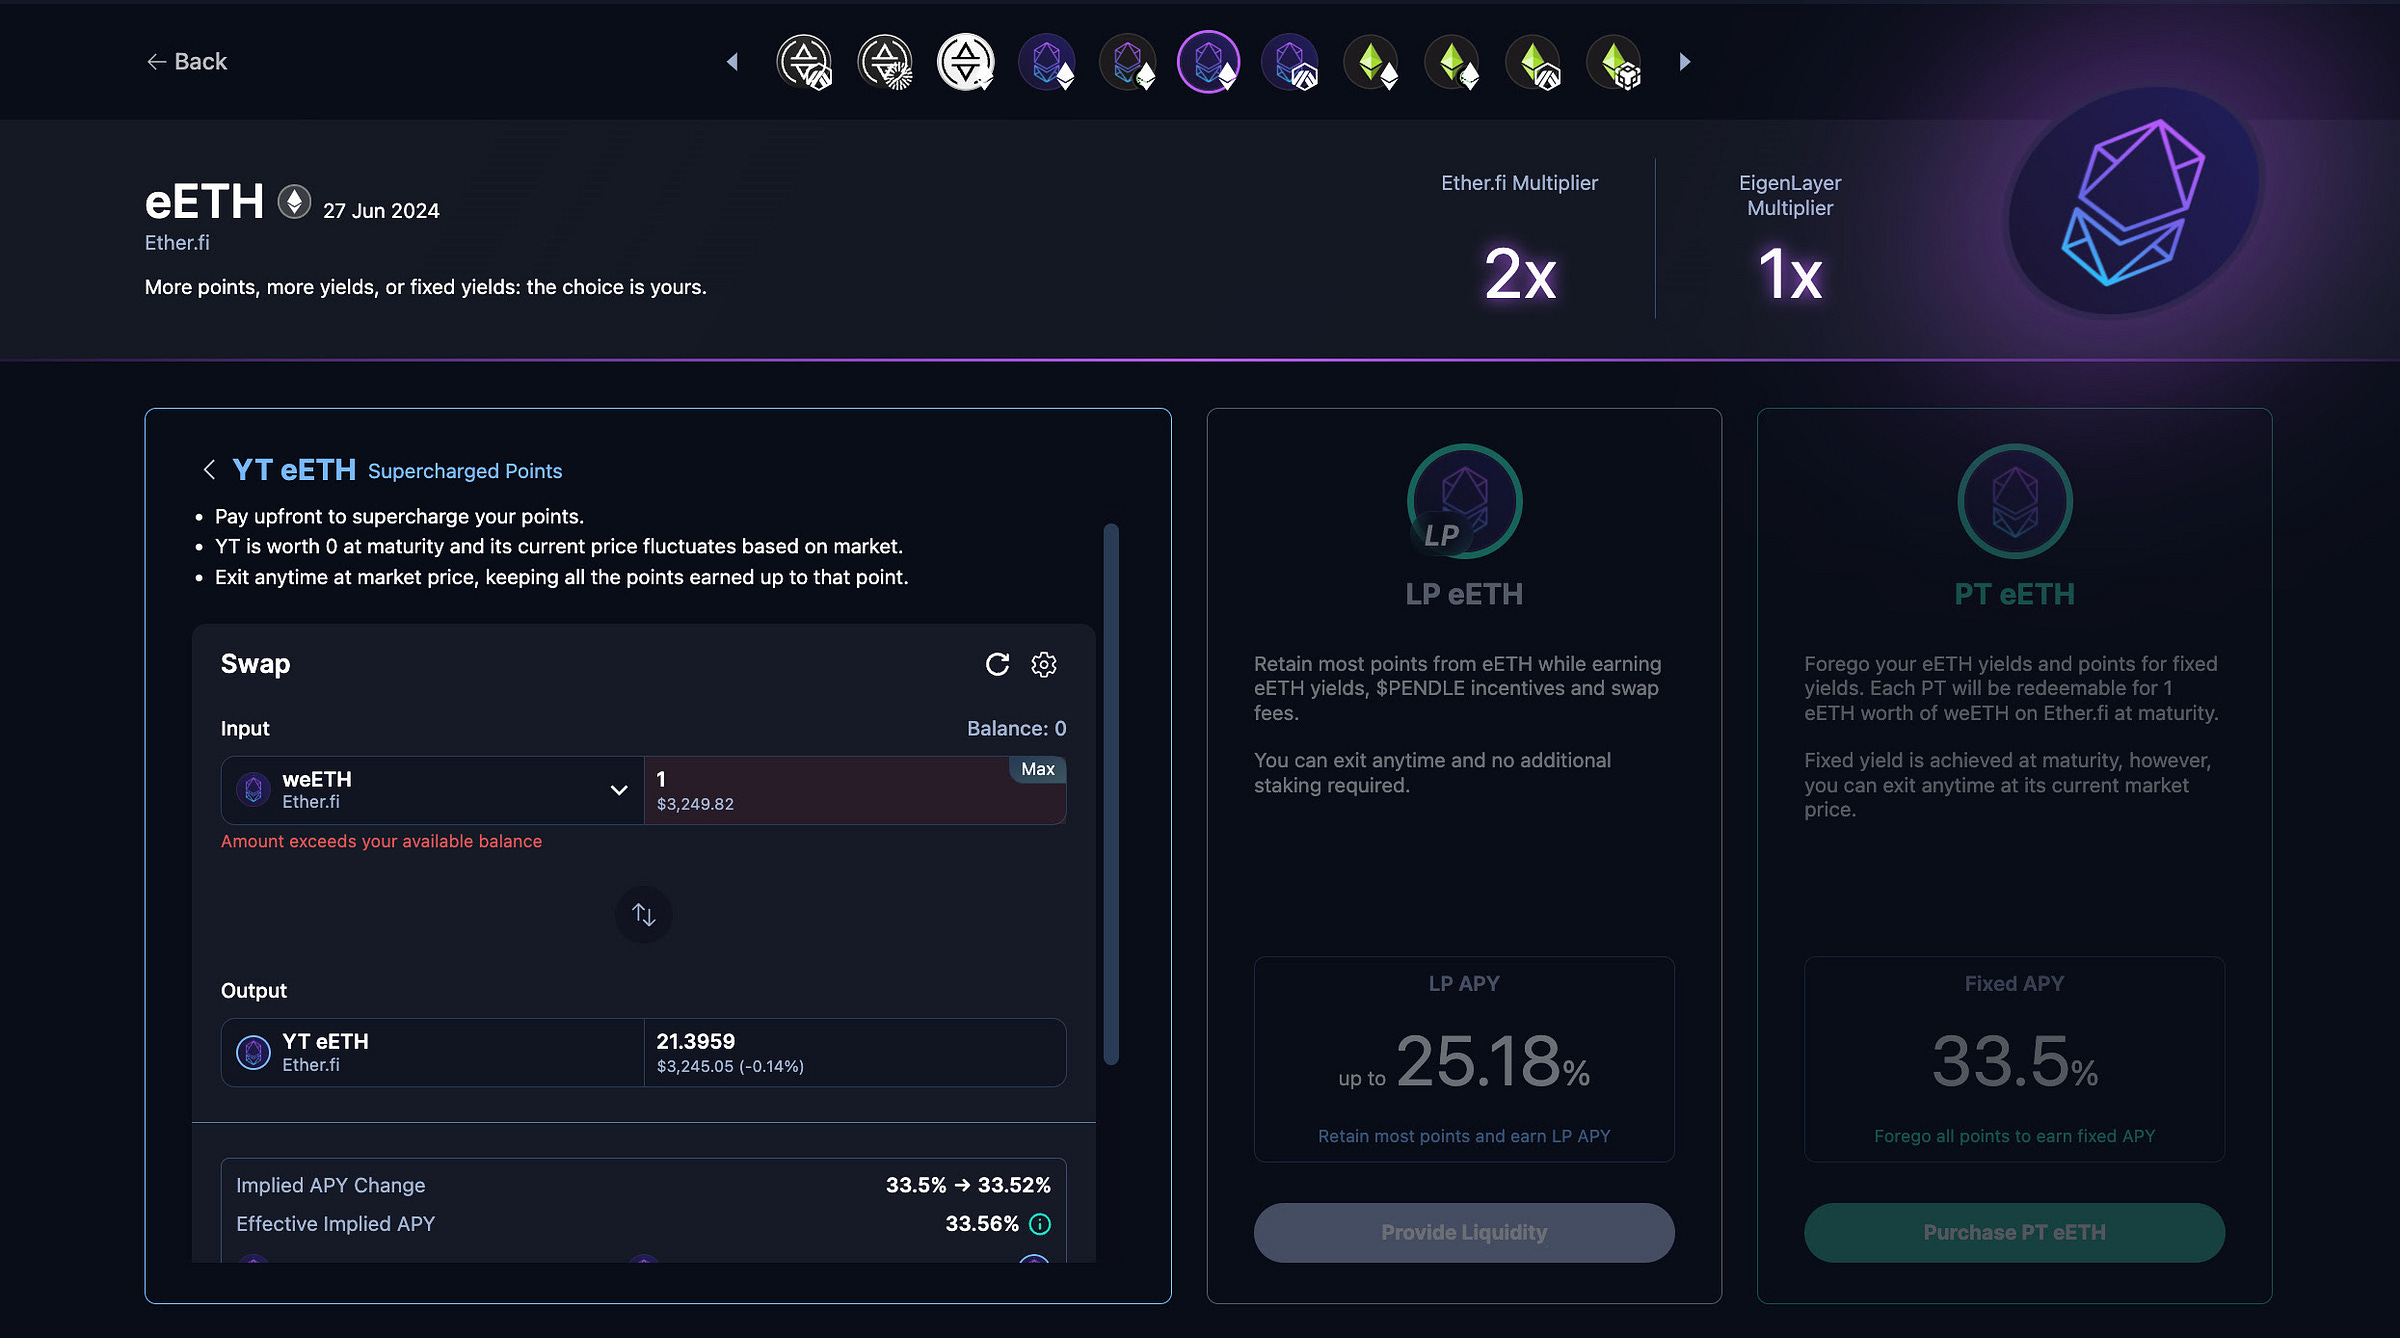
As you can see in the image, buying 1 weETH of YT gives you access to the yield + points generation of 21.39 weETH until June 27, 2024.
And that's why this product is so highly sought after by farmers today: by taking positions on YT products, they speculate that the value of the points generated by the YT will be greater than the value of the underlying asset.
To execute this kind of strategy, it's necessary to have a comparative table of points earned through Pendle YT product.
Here's one made by user "Stephen | DeFi Dojo" on X: it will help you estimate the value of your earned points relative to the loss of value of your underlying asset.
But it's not all that simple since the value of the YT varies depending on when you buy it.
The lower its price, the higher your point generation will be, and vice versa. Its price varies depending on two main parameters:
Its maturity date: the closer the YT is to maturity, the cheaper it is.
Supply and demand: the more people buy PT, the cheaper the YT becomes, and vice versa.
Note: to measure the valuation of a PT/YT, the term "Implied APY" is used.
Implied APY is calculated based on the ratio between the price of PT and YT. It is used as a reference for PT/YT trading.
How to effectively use the YT
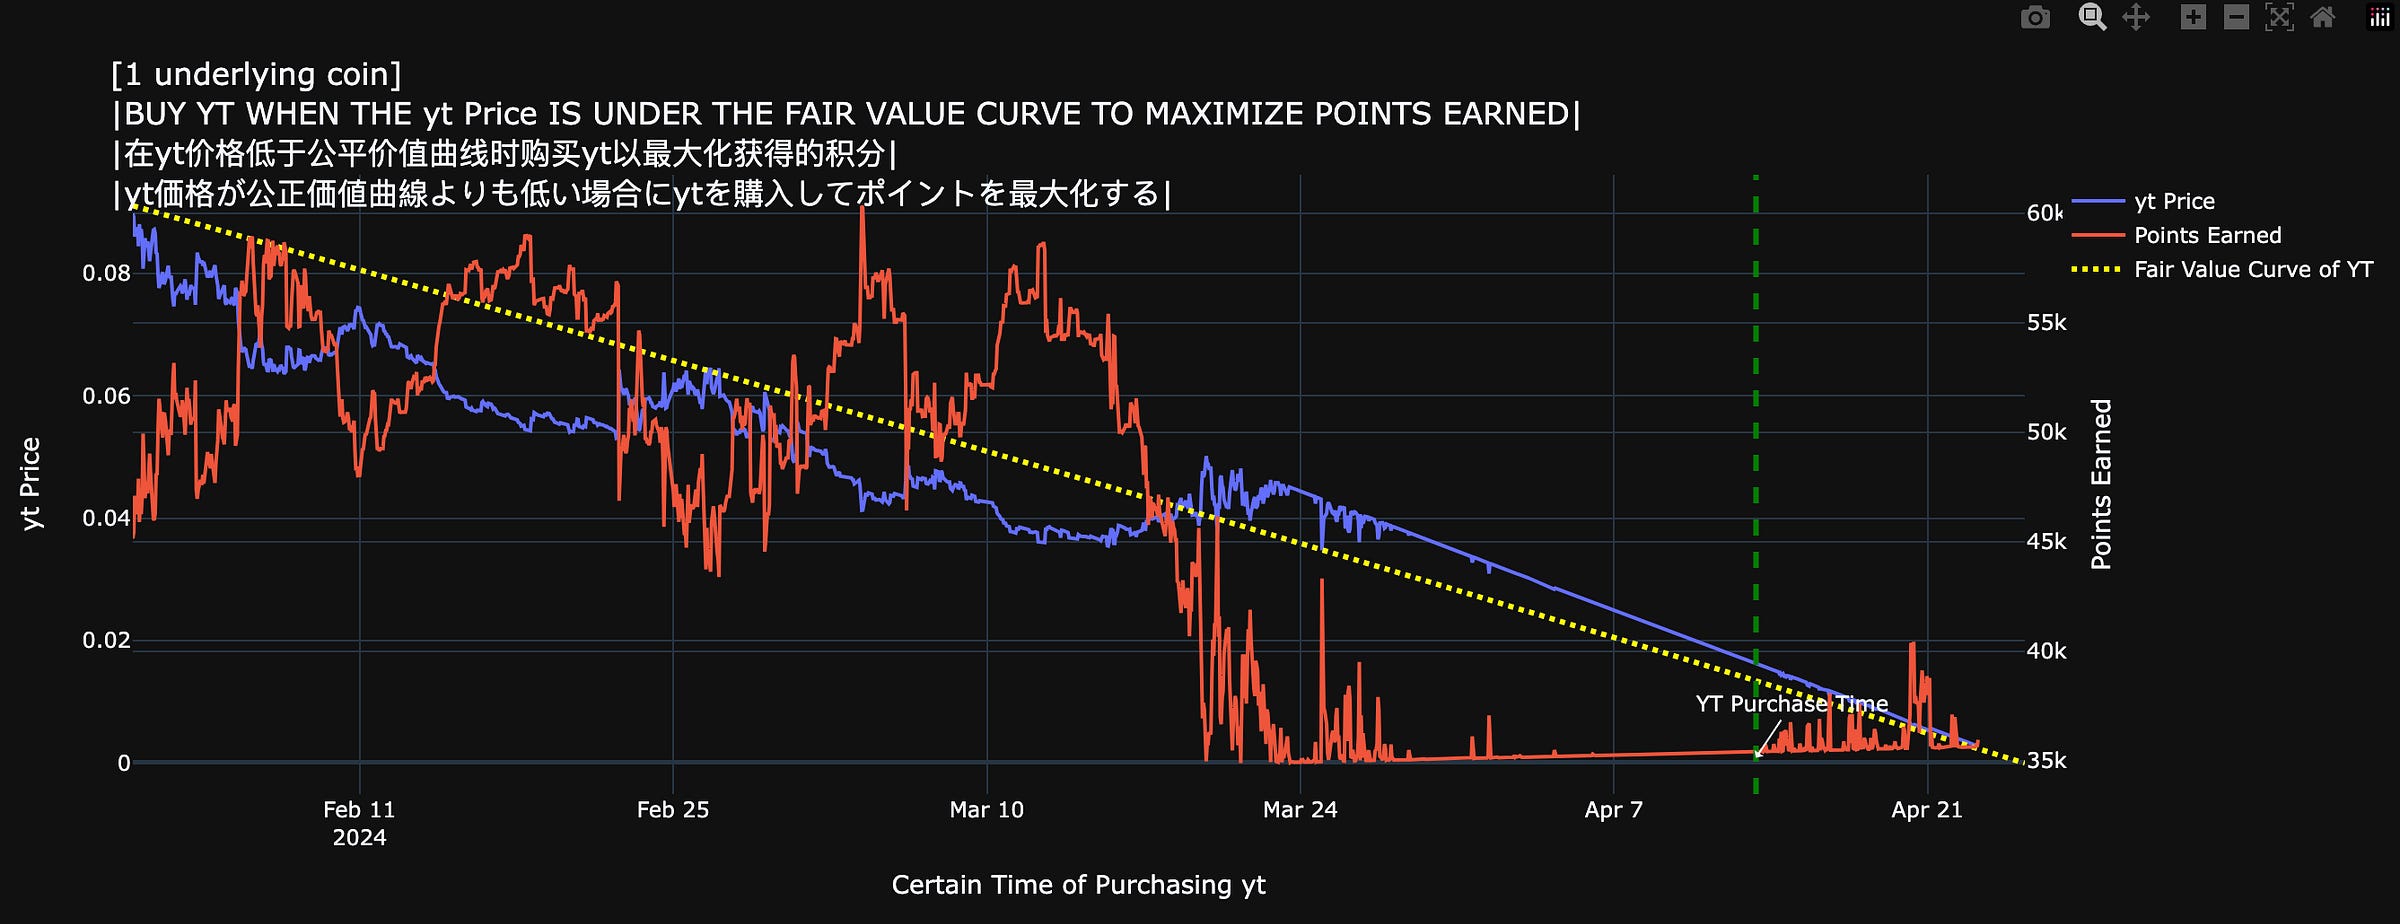
While it's challenging to clearly define when the YT is overbought or oversold, Twitter user "Labrin0x95(&quant_sheep)" has created a modeling tool to facilitate your decision-making.
It relies on the YT's implied APY to calculate its "fair value" over a defined period of time (represented in yellow on the graph).
source : @quant_sheep
As you can see, if the implied APY of the asset is stable, the value of the YT decreases linearly over time (due to its maturity date).
However, since we are not in a stable market, supply and demand cause significant fluctuations in the price of YT (blue curve).
To outperform the majority of users, you should therefore buy YT when its price is below its fair value.
Now, how can you detect these opportunities?
Well, they mainly occur during particular events such as a token generation event (TGE), depeg, launch of a new project, price movements, etc.
When the market is fearful, people secure their yield with PT: the price of YT decreases, and vice versa.
If you're looking for the best timing to position yourself, monitor the implied APY from the order book, and when a rate suits you, place a limit order to execute at that precise rate.
You'll experience less slippage and no gas fees (convenient on Ethereum).
Once you've purchased YT, you can use Labrin0x95's tool to see exactly where you stand.
By filling in the requested information on the document, the table will determine how you position yourself relative to other users.
It will estimate your total number of points and allow you to see if your strategy is effective or not. Remember that this tool calculates the number of points of 1 protocol. So if your position entails you to farm few protocols, run the same tool for each type of points.
source : @quant_sheep
There you go! You now have all the cards in hand to make some nice investments on YT.
May luck be on your side!
The Optimist Social accounts:
Twitter: The Optimist
Farcaster: Subli_Defi
Notion (Research database): https://sublidefi.notion.site/sublidefi/Subli_Defi-c57a3141c983433ca74e785a0bf1bcd0
Disclaimer: Nothing in this content is financial advice. We may have some positions on the presented projects, however these articles are written in a non biais way so that you can make you own opinion out of it.
Do your own research before investing, and remember that Crypto is extremely volatile and risky.


